Travelling Salesman Art
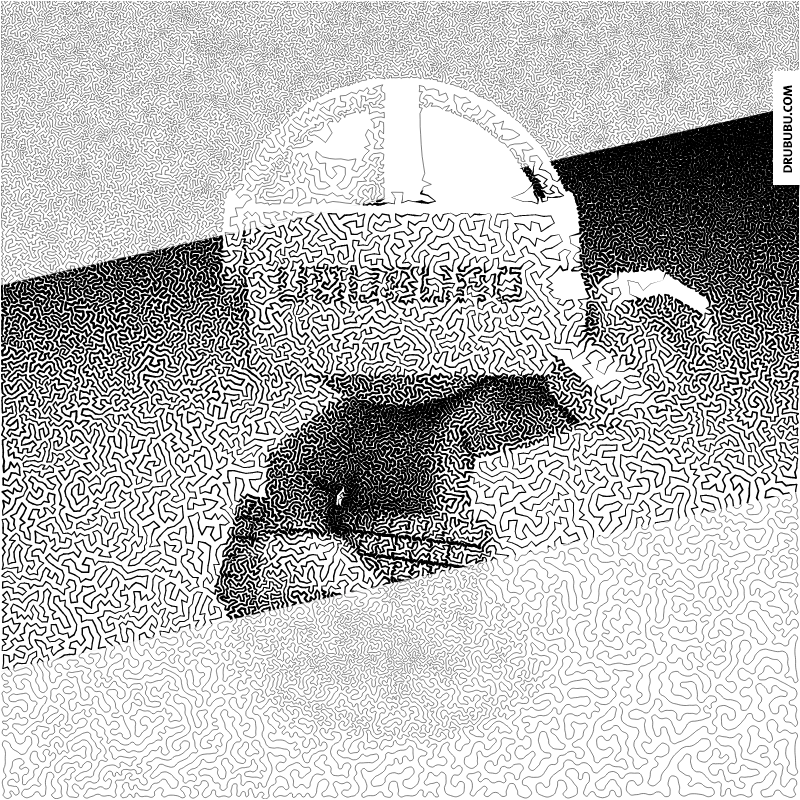
TSP art or travelling salesman problem art, invented/discovered by Robert Bosch, is an image which can be drawn with one single line.
If you draw it by hand you can use one single stroke without lifting your pencil.
The self portrait below consists of 250.000 positions that are interconnected by one single line.


Travelling Salesman Problem
A salesperson wants to visit a number of cities in the shortest possible way; a city can only be visited once and he/she has to finish in the city were he/she started. Doesn't sound that difficult, but it is.
The number of possible combinations is rapidly increas.
| cities | possible combinations |
| 3 | 2 |
| 4 | 6 |
| 5 | 24 |
| 6 | 120 |
| 7 | 720 |
| 8 | 5.040 |
| 9 | 40.320 |
| 10 | 362.880 |
| 11 | 3.628.800 |
| 12 | 39.916.800 |
| 13 | 479.001.600 |
| 14 | 6.227.020.800 |
| 15 | 87.178.291.200 |
| 16 | 1.307.674.368.000 |
| 17 | humongous |
How to Create TSP Art
The number of programs to generate TSP art is limited.
Stipplegen by Evil Mad Scientist Laboratories is probably the most convenient one to use. you can generate your TSP art in one a single program. As long as the number of positions is not too high, this is the best options.
Although this program is convenient and easy to use I use, I prefer to combine two separate programs with some self-written software, which is slightly more difficult, but the result will be generated faster and the number of positions is practically unlimited.
The following text explains how you can generate TSP art yourself.
Generate Stippled Image
The program I used for this part is an open-source program named Voronoi.
The name Voronoi refers to Voronoi diagram, which is the technique that is used to generate a stippled image.
The program must to be executed in the MS-DOS command line console; I admit, not the most sexy interface, but the result is generated fast and the quality is high.
The program has multiple options for the amount of points you need and more.
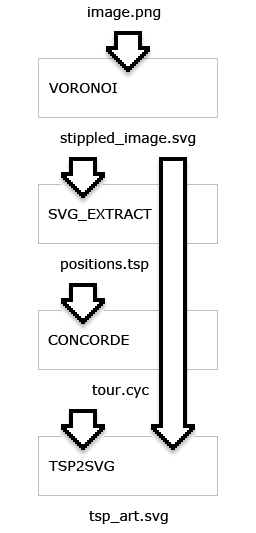
The input is a PNG image, the output of the program is a SVG file that can be opened in Adobe Illustrator and Inkscape.

You could use the generated stippled image as an end result or use it to generate TSP art.
To generate the tour - the line that interconnects the positions - I have used Concorde that is avialable at Concorde.
You can not use SVG as an input file, you need a so-called TSP file.
A TSP file has a very simple format.
The first six lines describe some features used by the program, the last line contains the word EOF, which means 'end of file'. All other lines start with a number 'the index' - in slang - followed by the x and y position.
The TSP file is used as input for the Concorde program.
The SVG file can be opened in a text editor. If you take a look at the readable content of the SVG file, you will nocite that most lines contain the word 'circle' and the words 'cx', 'cy' and 'r'.
The line represents one of the circles drawn in Adobe Illustrator of Inkscape, or your bowser if you open the SVG file.
You need the positions for the TSP file.
You can manually copy and paste the positions from your SVG to the TSP file, but this will take a lot of time, especially if the number of positions is large.
I have written a small program that can executed in the MS-DOSs command line console and that performs this action automatically. You can download it here.
Save the file and run it inside the MS-DOS console to convert the SVG file into a TSP file.
Generating Tour
To generate the tour - the line which interconnects all the positions - the program available at Concorde is used. The TSP file is opened in Concorde (File > Open) and once it has appeared on your screen, you can instruct the program to generate the tour.
You have some options to calculate the tour. The option that seems to be the best is Lin kernigham (Heuristics > Lin Kernigham). Once the tour has been calculated, you save the tour as a CYC file (File > Save Tour).
Just like SVG a CYC file is a readable file consisting of a series of numbers; or, more precisely, indexes.
Now you have an SVG file, a TSP file and a CYC file.
The indexes in the CYC file refer to positions in the TSP file and the SVG file.
As we need the radius of the positions, the final result is generated using the SVG file and the CYC file.
In this example the tour starts with the first position in the SVG file, the next position being the 571th position in the SVG file and so on.
If you draw a line between the indexes of the positions in the listed order in the CYC file, your TSP art will become visible.
The last step in the process is combining both files and generate a SVG file.
Again, it is possible to create an SVG file manually, but this will take a lot of time.
I have written a small program that can be executed in the MS-DOSs command line console and that performs the action automatically. You can download it here.
Save the file and run it inside the MS-DOS console.
The result is an SVG file - tsp_art.svg - with the TSP art vector illustration.
Workflow

Extra
To generate the image on top of this page I chose to generate a stippled image with different radii. When a line is drawn from one position to the next position, the radius is used to determine the thickness of the line between the two positions.

By changing the thickness, the result will have more contrast, which makes the image more vivid, more detailed.


0 Comments