
Introduction
Network monitoring is crucial for the Raspberry PI network's security and stability. The process allows users to identify potential problems, such as slow performance or security breaches, and take corrective action.
This guide teaches you how to monitor network traffic on Raspberry Pi using Ntop and Darkstat.

Prerequisites
- A Raspberry Pi system (this tutorial uses Raspberry Pi based on Debian 10).
- Access to the terminal.
- Sudo privileges.
- A text editor.
Note: Before installation, update and upgrade your system with sudo apt update && sudo apt upgrade.
Monitor Network Traffic Using Ntop
Ntop is a free and open-source network traffic monitoring tool. The utility tracks bandwidth usage, identifies bottlenecks, and monitors network performance and system health.
Ntop improves the performance and security of any network. The following text elaborates on how to set up Ntop in a Raspberry PI system.
Step 1: Download Ntop Package
Download the Ntop deb package for the Raspberry Pi from the official website. To accomplish this, use the wget command:
wget http://packages.ntop.org/RaspberryPI/apt-ntop.deb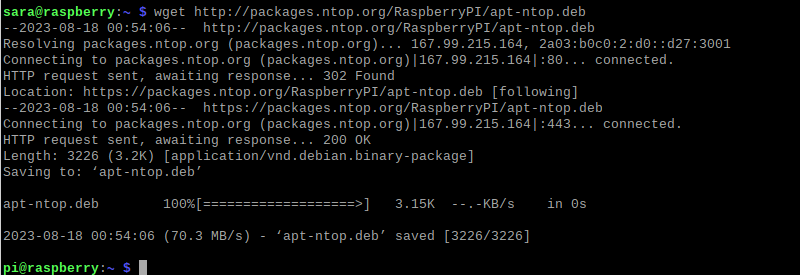
Note: The official download links change over time. Make sure to check http://packages.ntop.org/ if the current link does not work.
Step 2: Install Ntop deb Package
To install the previously downloaded Ntop deb package, run the following:
sudo apt install ./apt-ntop.deb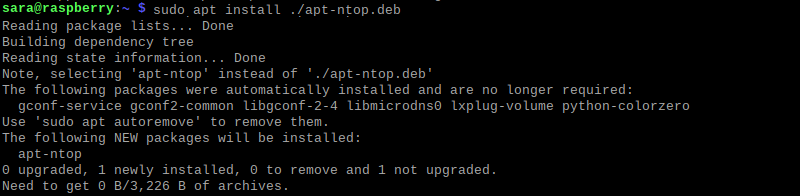
After completing this step, update the repository once again:
sudo apt update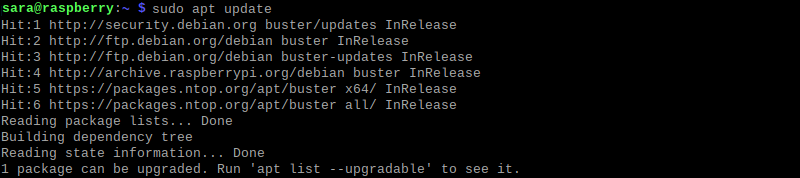
Step 3: Install Additional Packages
Next, install additional packages which complement Ntop. Once installed, the packages provide:
- Ntopng. This web-based monitoring application allows users to visualize and analyze network traffic data.
- Nprobe. The network probe, which collects network traffic data from various sources.
- n2n. The firewall bypassing tool.
To install the packages, run:
sudo apt install ntopng nprobe n2n
Wait until the output shows the process is done.
Step 4: Configure Ntopng
After installing Ntopng, configure the program to use the correct network interface and port number. The process requires changing the Ntopng configuration file.
Note: Run ifconfig to verify the correct network interface.
To make changes in the Ntopng configuration file:
1. Open the Ntopng config file in a text editor of choice. This tutorial uses nano.
sudo nano /etc/ntopng/ntopng.conf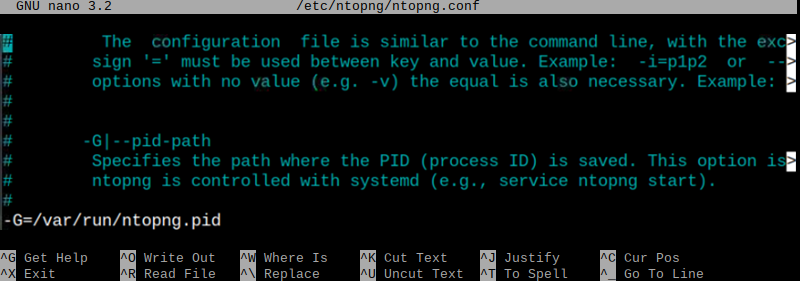
2. Find and uncomment the following lines:
-i=eth1-w=30003. Find the Interface section.
4. Change the -i section to match the interface name. For example, wlan0:
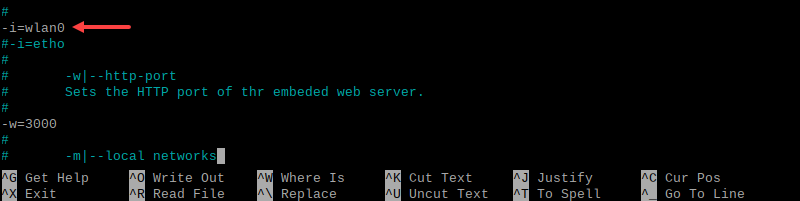
If you use a different network interface, replace the wlan0 with the interface name you want to monitor.
5. Save and exit the file.
Step 5: Edit Network Interface and IP Range
Specify the IP range and the network interface that the Ntopng service will monitor. Edit the ntopng.start file to configure the parameters:
1. Open the ntopng.start file in a text editor:
sudo nano /etc/ntopng/ntopng.start2. Add the following:
--local-networks "[your IP range]"Add the IP range that is a part of your local network. This tells the tool how to differentiate between internal and external traffic and to provide information on the internal network traffic.
--interface ["your interface"]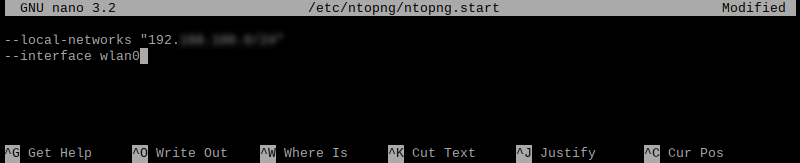
3. Save and exit the file.
Step 6: Start ntop
After performing the configuration step, start the Ntopng service on the Raspberry Pi. Run the following command:
sudo systemctl start ntopng
The command shows no output.
Step 7: Access the Web Interface
To access the Ntopng web interface:
1. Open any browser and type the address https://Pi-IP:3000 to open the Ntopng login page:
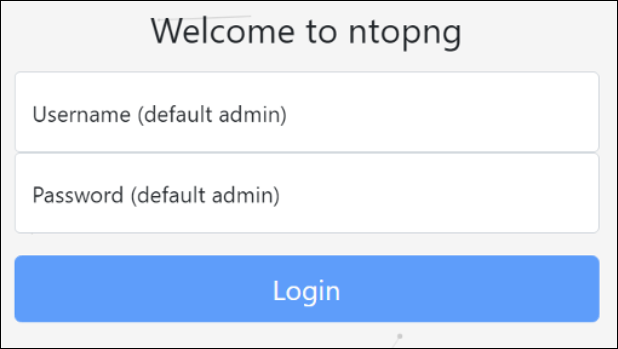
2. Type the default username and password as admin.
3. Click the Login button.
4. Change the default password.
5. Once logged in, click on the Dashboard icon and switch to Traffic Dashboard:
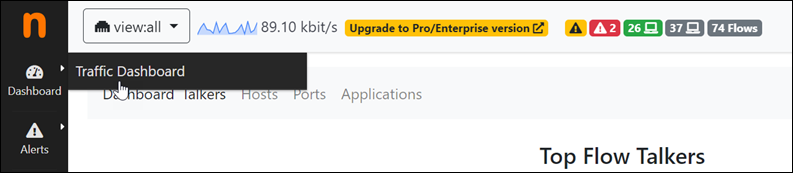
Now, monitor the network using the Ntop Traffic Dashboard.
Monitor Network Traffic using Darkstat
Another option to monitor network traffic on Raspberry Pi is Darkstat. Darkstat is a lightweight, real-time network traffic monitoring tool that runs in the background on the Raspberry Pi.
The utility captures network traffic, calculates statistics, and provides a web interface for viewing the data in graphs. Darkstat also supports IPv6.
The following sections provide a step-by-step guide to installing Darkstat on the Raspberry Pi.
Step 1: Install Darkstat on Raspberry Pi
It's easier to install Darkstat than Ntop since the Darkstat repository is already included in the official Raspberry Pi repository list.
To install Darkstat on Raspberry Pi, use the following command:
sudo apt install darkstat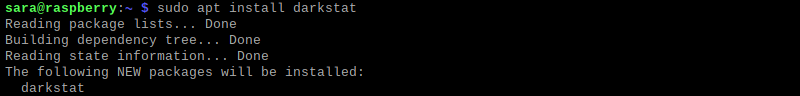
Verify the installation is complete by checking the Darkstat version:
darkstat --version
Step 2: Modify Darkstat Configuration
To change the Darkstat configuration file on Raspberry Pi, follow these steps:
1. Access the file using a text editor:
sudo nano /etc/darkstat/init.cfg2. Find the following section:
START_DARKSTAT=no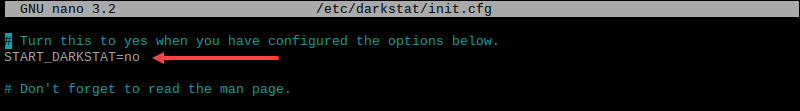
3. Change no to yes.

4. Find the INTERFACE section:
INTERFACE="-i [interface name]"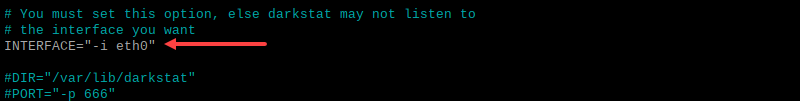
5. Change the interface name to the interface you want to monitor. For example, enter wlan0.

Step 3: Restart Darkstat
To continue, run systemctl restart:
sudo systemctl restart darkstatThe command shows no output.
Step 4: Verify the Darkstat is Running
The last part before accessing the Darkstat web interface is to verify the service is active.
To do so, enter:
sudo systemctl status darkstat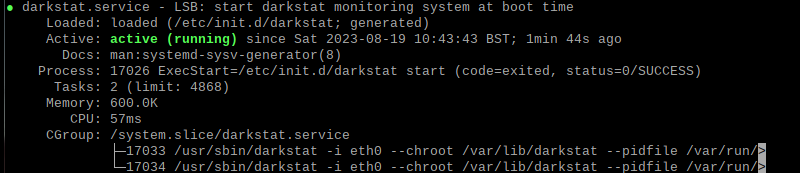
The output shows the green active (running) status for the program.
Step 5: Access Darkstat Web Interface
To access Darkstat, follow these steps:
1. Run the hostname command to find the Raspberry Pi IP address:
hostname -I
The local address in this example is 10.0.2.15.
2. Use the following syntax to access Darkstat:
http://[hostaddress]:667Replace the [hostaddress] parameter with the Raspberry Pi IP address.
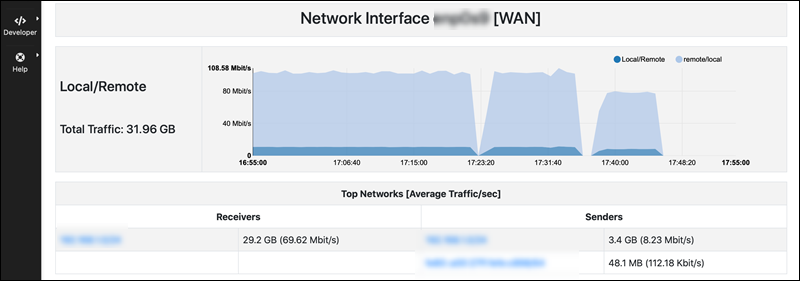
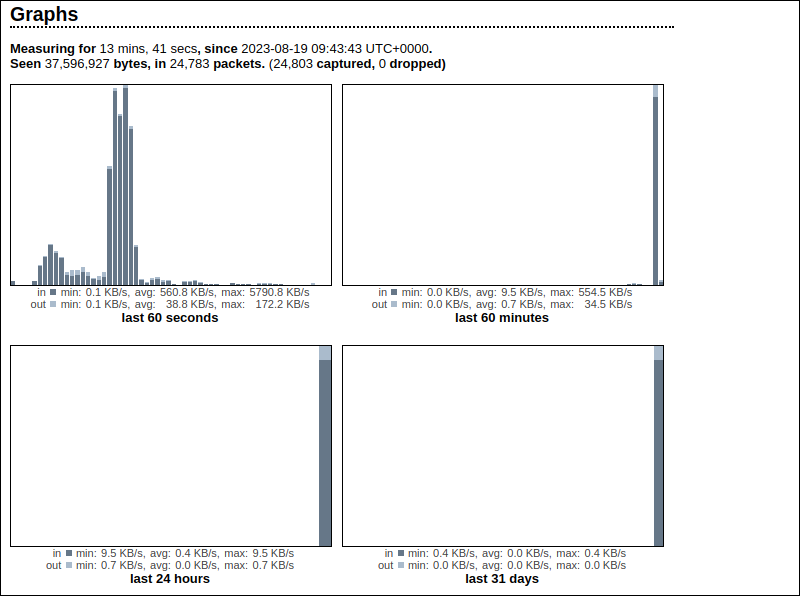
In this example, the address we used in a web browser is:
http://10.0.2.15.:667The browser accesses Darkstat. The web interface shows the network traffic at different timings and ensures a successful Darkstat service setup on the Raspberry Pi device.
Conclusion
After reading this article, you now know how to monitor traffic on Raspberry Pi.


0 Comments